Research Note · Measurement Validation
Proving the Fixture Before Trusting the Capacitor
Instrument floor, contact control, repeatability, drive dependence, and the 50 Hz problem
Before capacitor distortion data can be trusted, the QA403 analyzer, contacts, wiring, and environmental pickup must be measured as part of the experiment.
The resistor control remains at the residual floor, removal and refitting are repeatable, and single-point shielding reduces 50 Hz pickup by 18.66 dB.
Measuring harmonic distortion in a ceramic capacitor at 20 Hz comes down to a simple chain: a generator drives the part in series with a shunt resistor, and the spectrum of the voltage across that shunt carries the current. Everything along the chain contributes to that spectrum. The analyzer contributes its own floor, the contacts holding the part contribute their nonlinearity, the wiring contributes loop area, and the room contributes mains field.
So the first series run on a new fixture measures the fixture. This note covers that series: the instrument floor, a control run with a resistor in the same contacts, repeatability across removal and refitting, the amplitude dependence of the harmonics, and the one problem that turned out to dominate everything else — 50 Hz pickup.
All measurements in this series were made with the QuantAsylum QA403. The earlier note From Budget Constraint to Measurement Platform explains why this analyzer was selected and how it fits into the wider HighSNR Lab measurement system.
1. The measurement chain
The measurements in this note were made with the temporary breadboard fixture documented in the 17 September report. It holds the 1206 device in the same contacts used for the resistor control and the removal-and-refit tests. This is the experimental rig for the series below, not the later 3D-printed enclosure concept.
The device under test sits in series between the generator output and a shunt resistor, and the shunt returns to a single local ground point, GND*. The left channel watches the node ahead of the capacitor. The right channel reads the shunt differentially, R+ and R− landing directly on the shunt terminals as a Kelvin pair, twisted together on the way back.
| Parameter | Working value |
|---|---|
| Excitation | 20 Hz sine |
| DUT | Fenghua 1206B106K100NT, 10 µF, 10 V, X7R, ±10 %, 1206 (LCSC C165101) |
| Shunt | 1.2 kΩ |
| Analyzer | QuantAsylum QA403, QA40x software v1.223 |
| Full Scale Input | 0 dBV |
| Sample rate | 48 kS/s |
| FFT | 64K, Hann window |
| Averaging | 10 cycles, Reset Average before every point |
| Harmonics read at | 40 Hz (H2) and 60 Hz (H3) |
At 20 Hz a 10 µF capacitor has |Xc| ≈ 796 Ω, which sits close to the 1.2 kΩ shunt. Both the capacitor and the shunt carry a usable voltage at that frequency.
2. Where the instrument floor sits
With 50 Ω terminations on the QA403 inputs and the same software settings:
| Measurement | Result |
|---|---|
| Input noise, 20 Hz–20 kHz, L | −116.52 dBV RMS |
| Input noise, 20 Hz–20 kHz, R | −116.60 dBV RMS |
| Loopback THD, 1 kHz, −2 dBV, FFT 128K, 192 kS/s | ≈ −112 dB |
| Loopback THD, 20 Hz, −2 dBV, FFT 256K, 48 kS/s | ≈ −114.7 dB |
The two channels agree within 0.08 dB. The 20 Hz loopback figure is the number that matters here, and it sits roughly 50 dB below the harmonics the capacitor produces.
One practical note from this stage: the first runs showed USB supply around 3.21–3.25 V with intermittent LINK loss. A different cable brought it to 4.5–4.6 V. Everything measured at 3.2 V was discarded.
3. The contact control
The cleanest test of a fixture is a part that has no distortion to give. An 820 Ω resistor goes into the same contact points, chosen to sit near the |Xc| of the 10 µF capacitor at 20 Hz, so the operating levels stay comparable.
| Element in the fixture | H2 (40 Hz) | H3 (60 Hz) |
|---|---|---|
| 820 Ω resistor | ≈ −132 dBV | ≈ −132 dBV |
| X7R 10 µF, same contacts, same drive | −63.76 dBV | −55.90 dBV |
Both harmonics of the resistor sit at the residual floor. The capacitor reads 68 dB above that floor at H2 and 76 dB above it at H3. Contact nonlinearity in this fixture stays far below the effect under study.
4. Repeatability
The part was pulled out of the fixture, an 820 Ω resistor was measured in its place, and the same part went back in.
| State | R RMS, dBV | R THD, dB | H2, dBV | H3, dBV |
|---|---|---|---|---|
| Unit 1, stable run | −3.87 | −48.12 | — | — |
| Unit 1, rotated 180° | −3.90 | −52.8 | −66.79 | ≈ −60 |
| Unit 2, as fitted | −3.84 | −48.53 | −63.42 | −54.37 |
| Unit 2, after the resistor control and refitting | −3.95 | −49.65 | −63.76 | −55.90 |
A full removal and refit moved H2 by 0.34 dB and H3 by 1.53 dB. Rotating a part by 180° left RMS and THD essentially where they were.
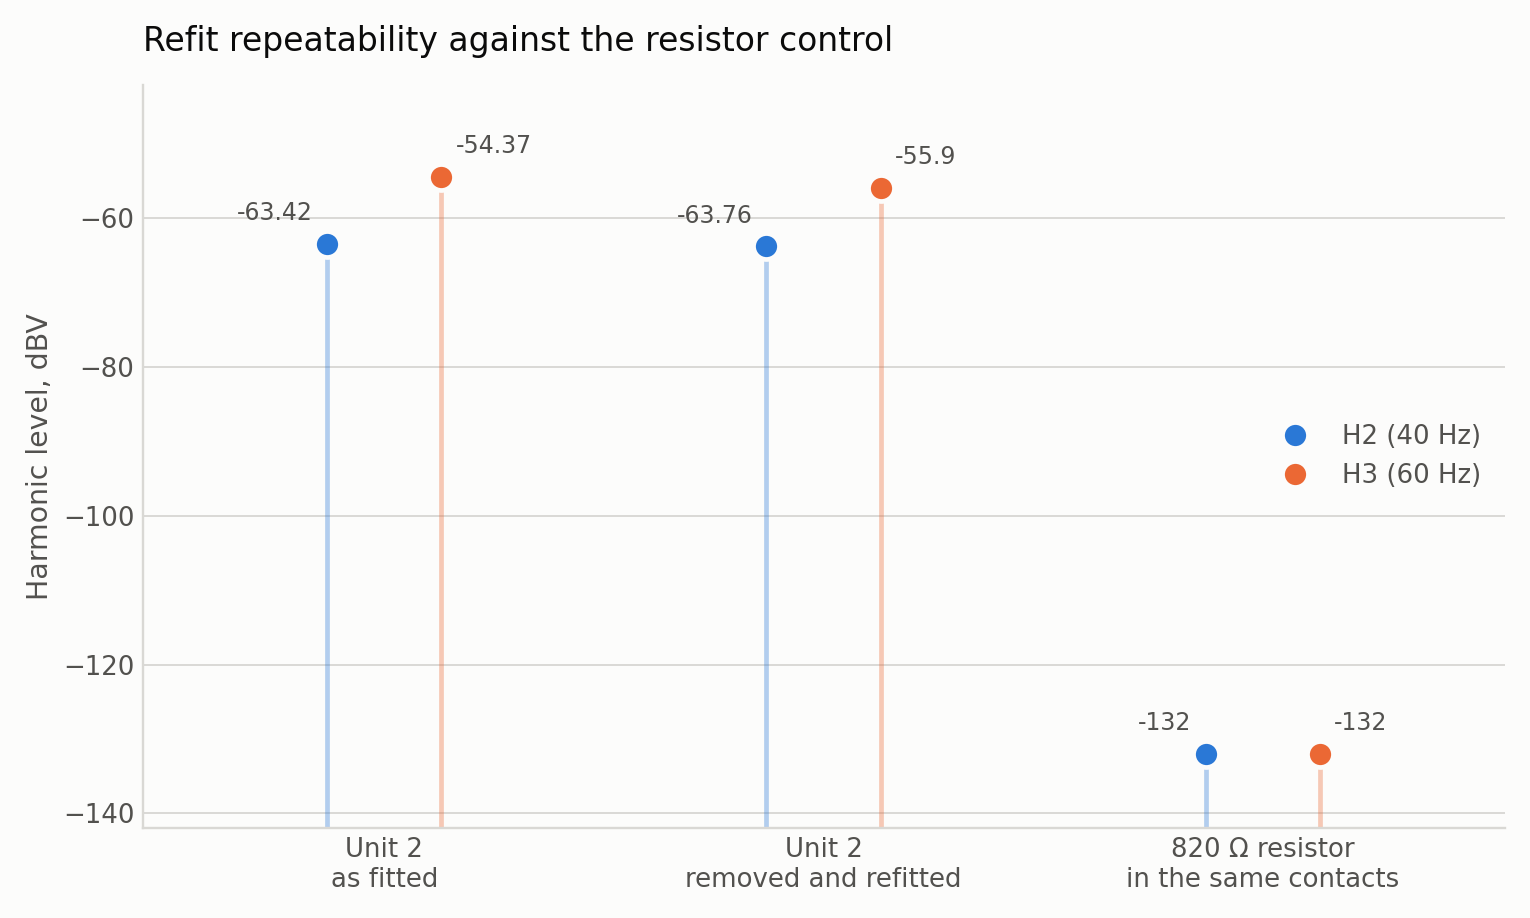
Figure 1 — The same part removed and refitted returns to the same harmonic levels. The 820 Ω control in the same contacts sits at the residual floor.
This is the property the fixture was built for: contact force repeats, so the contact check gets done once and carries over to the series.
5. Harmonics against drive level
The amplitude series stayed inside one generator range to keep internal range switching out of the data. Frequency 20 Hz, Reset Average and 10 averages at every point.
| Generator level, dBV | H2 @ 40 Hz, dBV | H3 @ 60 Hz, dBV |
|---|---|---|
| −11 | −77.40 | −67.93 |
| −9 | −74.74 | −64.57 |
| −7 | −71.93 | −61.57 |
| −5 | −68.87 | −59.00 |
| −3 | −65.67 | −56.80 |
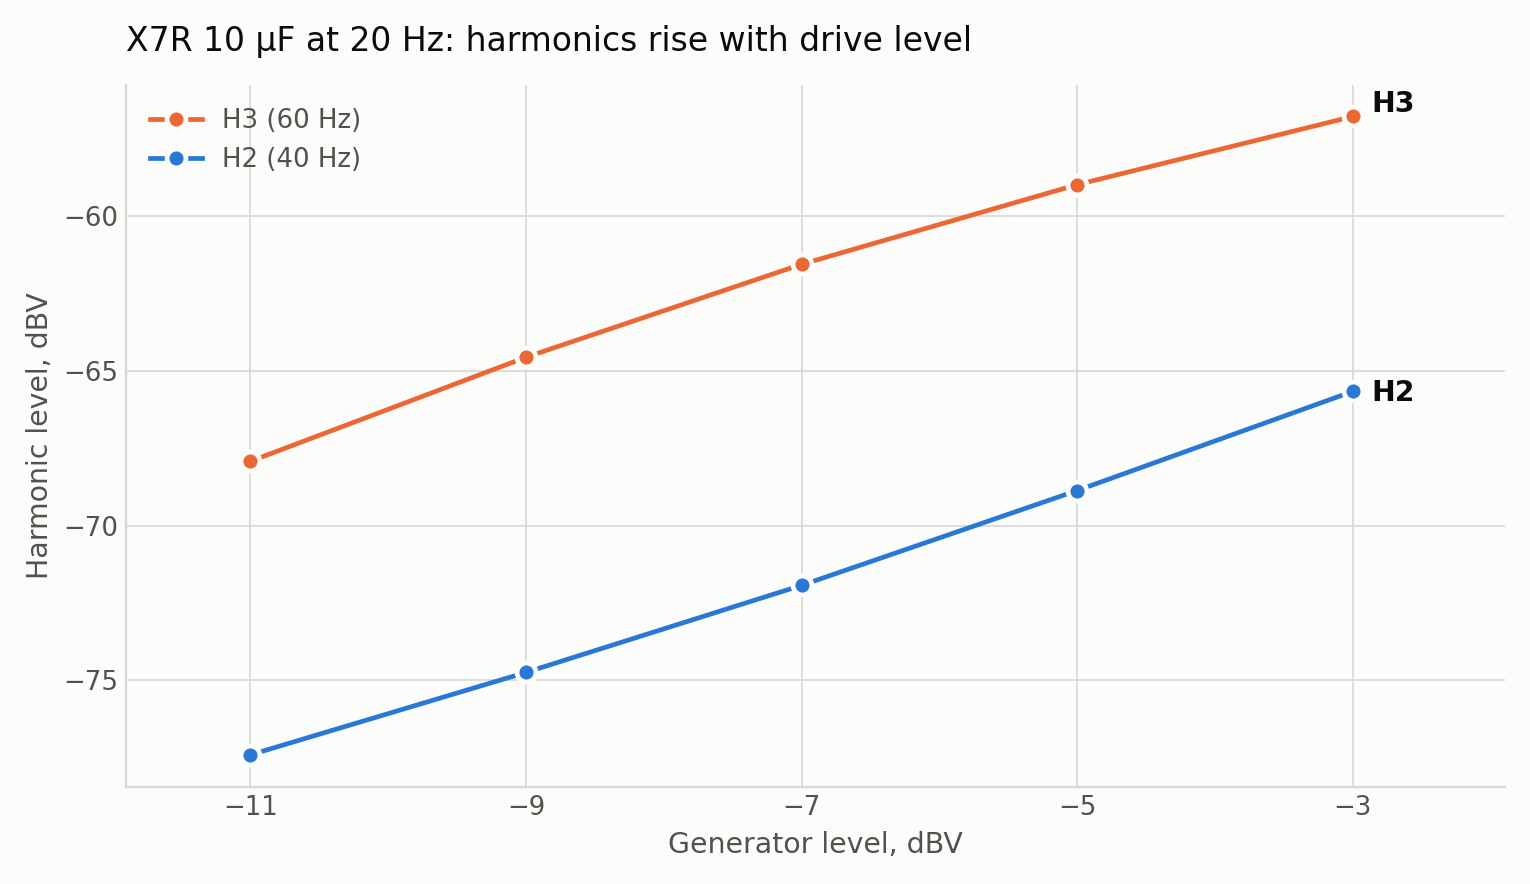
Figure 2 — H2 and H3 against generator level, one generator range, 20 Hz.
Across 8 dB of drive, H2 rises by about 11.7 dB and H3 by about 11.1 dB. Both curves are monotonic, and H3 stays above H2 by 8.9 to 10.2 dB across the whole range. This series counts as preliminary; it gets repeated once the shielding is finished, and that repeat becomes the reference set for the application note.
6. The 50 Hz problem
A 50 Hz line appeared in every spectrum, along with 100, 150 and 200 Hz. It has nothing to do with the 20 Hz excitation, so it belongs to the environment. A sequence of diagnostic configurations separates the analyzer's own behaviour from what the fixture picks up.
| Configuration | 50 Hz level |
|---|---|
| Inputs open, everything disconnected | strong 50 Hz and harmonics; RMS ≈ −105 dBV both channels |
| R+ terminated with 50 Ω at the analyzer | ≈ −140 dBV, floor −150…−160 dBV |
| Fixture output to R+ hard shorted | 50 Hz remains a distinct peak, −125…−130 dBV |
| Working setup, no shield | −112.26 dBV |
| Working setup, metal shield bonded to GND* at one point | −130.92 dBV |
| Differential R+/R− referenced to one GND* | −151.58 dBV |
| R+/R− tied together and left floating in common mode | up to −89 dBV, invalid as a control |
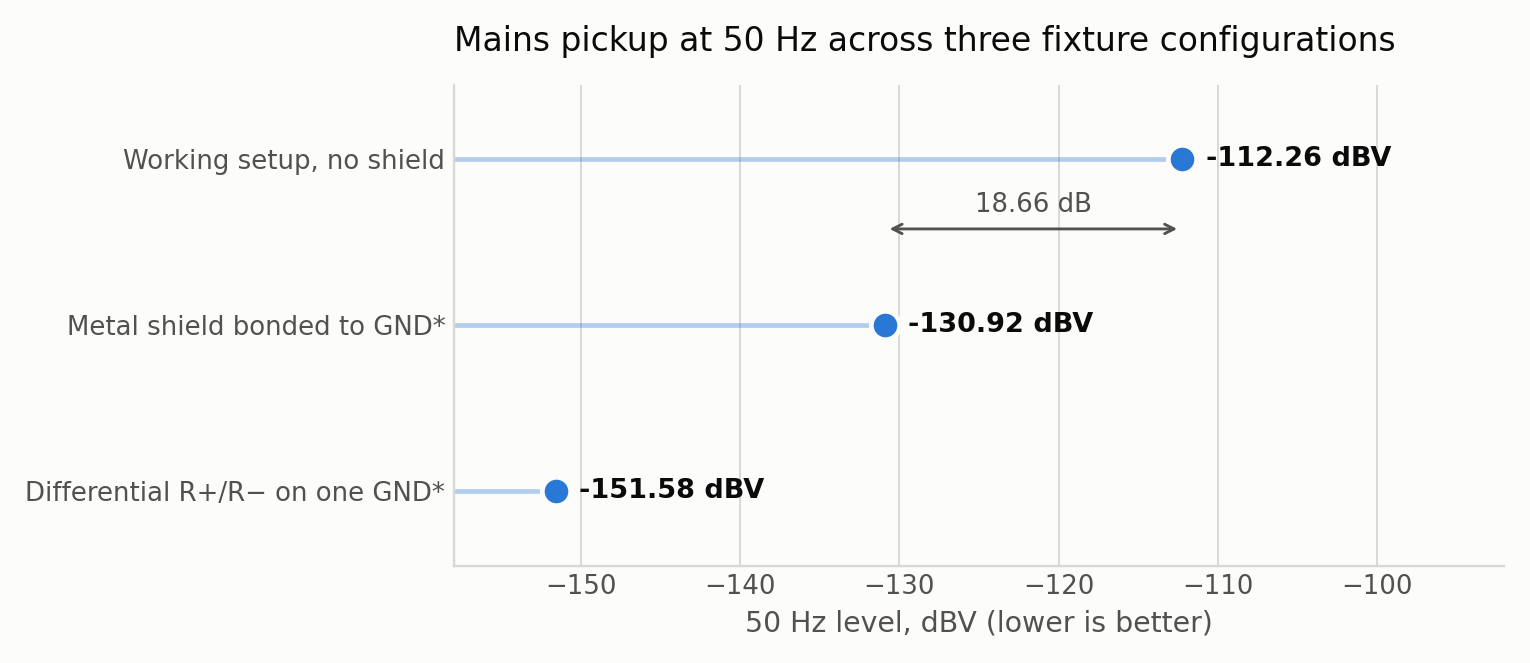
Figure 3 — 50 Hz level in the three configurations that matter. The shield is worth 18.66 dB, a factor of 8.6 in voltage.
The two working spectra, before and after the shield:
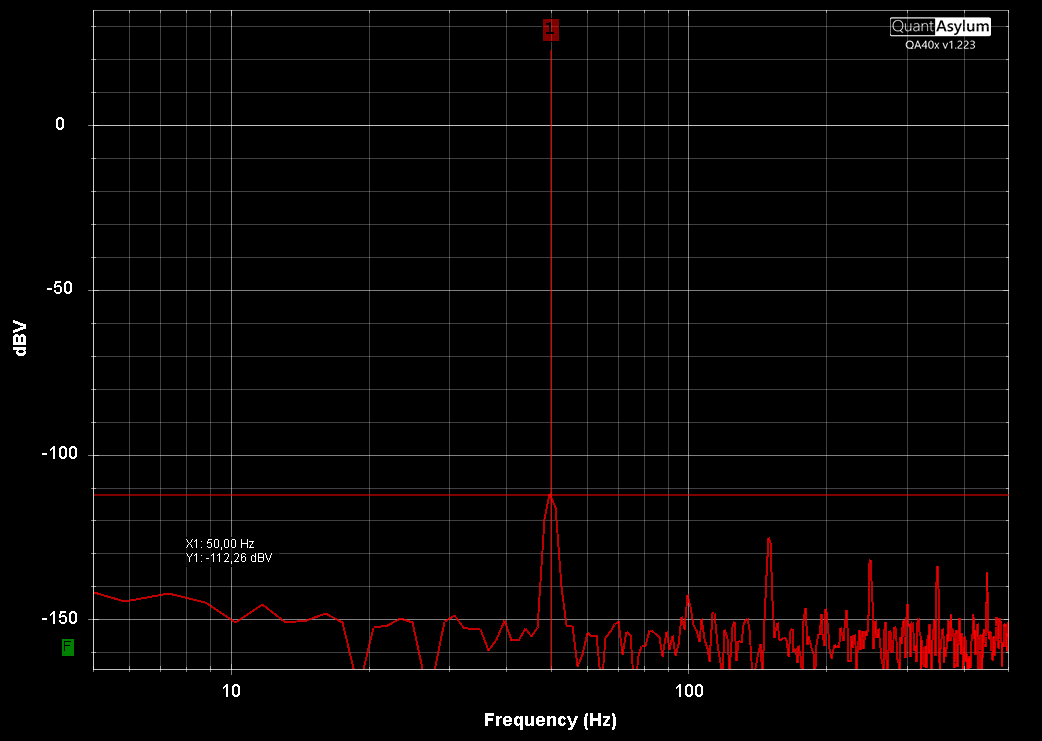
Figure 4 — Working configuration with no shield. Cursor on 50 Hz reads −112.26 dBV.
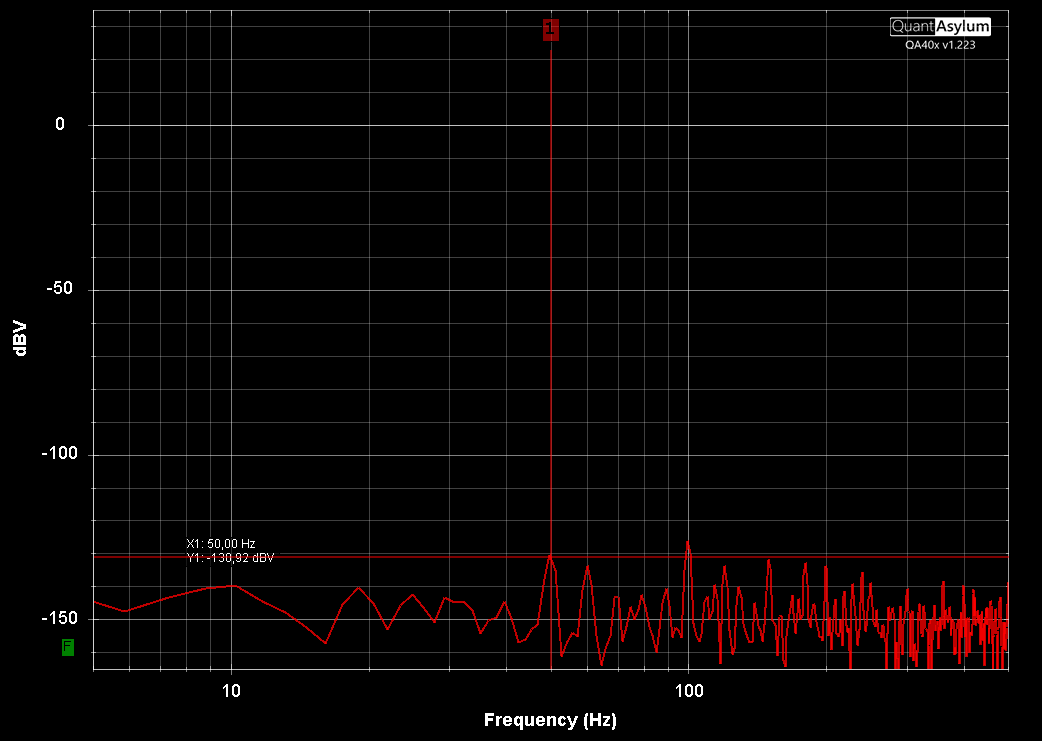
Figure 5 — Same configuration under a metal shield bonded to GND* at one point. Cursor on 50 Hz reads −130.92 dBV.
Two details from this stage are worth carrying forward. Grounding the enclosure gave another 6–7 dB over leaving the shield floating. And intermediate states with a partly disconnected generator coax degrade common mode quickly: breaking the cable at the fixture read −103 dBV, connecting the coax shield alone read −90.94 dBV. Those states belong to diagnostics.
7. What this series settles
−112…−115 dB while the capacitor produces H2/H3 in the −60…−80 dBV range.
control reads ≈ −132 dBV.
least two parts.
shield bonded to GND* at one point brings it down by 18.66 dB.
- The QA403 measures these harmonics with large headroom. Loopback THD lands at
- The fixture contributes no harmonics at a comparable level. The resistor
- The harmonics reproduce across removal and refitting, and they appear on at
- Rotating a part by 180° leaves RMS and THD unchanged.
- H2 and H3 grow monotonically with AC drive, H3 staying 9–10 dB above H2.
- The 50 Hz line comes from the open fixture wiring in an external field, and a
8. What stays open
The origin of H2 is the main one. An ideal symmetric nonlinearity favours odd harmonics, and this setup shows a strong second harmonic on two parts and in both orientations. A DC offset at the generator output is the obvious candidate, and an oscilloscope check of that offset stepped in 20 mV increments while H2 moved smoothly, so the check settled nothing. The next series uses an external generator with programmable DC offset and takes H2(VDC) and H3(VDC) at fixed 20 Hz and fixed AC level, with a resistor control run alongside.
A film capacitor control was attempted with a 2.2 µF CBB22 and is excluded from the conclusions. The fixture holds 1206 parts, so the film part needed extra contacts and a metal pressure plate, and the first assembly shorted the part through a missing insulator.
9. Next steps
0.1 mm, a 10–15 mm overlapping seam in place of a butt joint, and the shield bonded to GND* through a mechanical contact.
repeat as the reference data set.
number on contact spread.
contact spread.
- Shielding for the next fixture version: 1J85 / Permalloy 80 foil around
- Repeat the amplitude series once that shielding is final, and treat the
- Five full removals and refits of one part at a single drive level, to put a
- Ten to twenty parts at one drive level, to separate part-to-part spread from
- H2(VDC) and H3(VDC) with a controlled DC bias.
The QA403 used in this work was supplied by QuantAsylum at no charge. QuantAsylum has no editorial control over these measurements or conclusions.